Project Sentinel Weekly · June 29–July 3 (Week 2)
UI, Site Activity tracking and more!
 Aditya Nagachandra
Friday, July 3, 2026
·5 min read
Aditya Nagachandra
Friday, July 3, 2026
·5 min read
Week 2 is about the platform answering questions, not just showing footage: pick any day and get what happened, how many workers were on site, and what work got done — generated from the cameras, correctable by a human in one click. We’ve also finished our multi-cam setup for consistent tracking throughout the property.
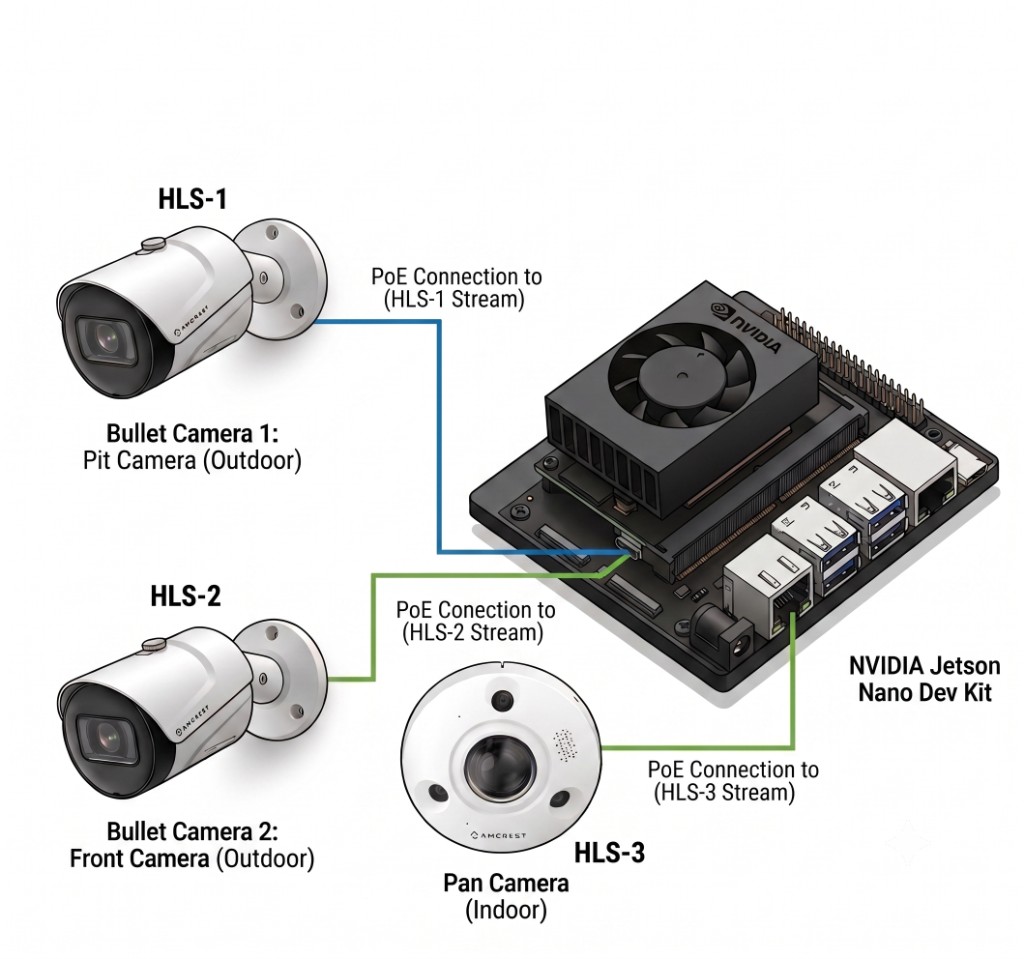
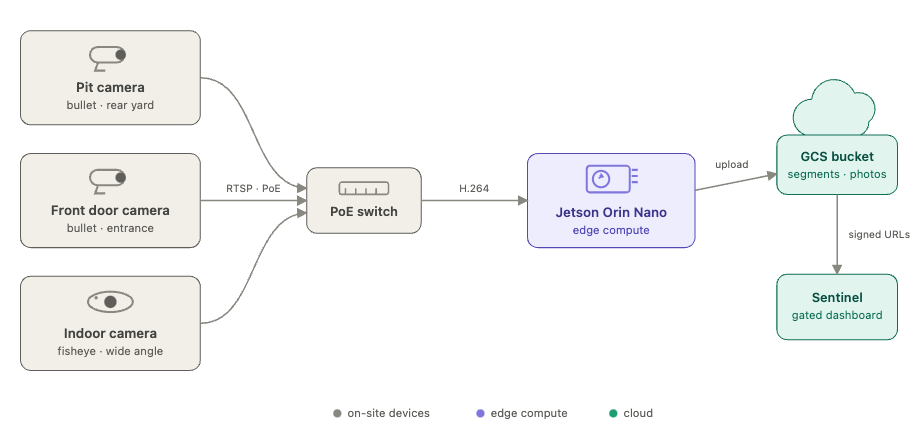
Hardware on the edge
What got built
Frontend
Timeline tab — zoomable strip of every captured frame (day → hour → minute), a measured-progress schedule pane, and a day-summary panel. One date picker locks all three panes to the same day; each pane stays independently pannable. This should in the future be reflecting the ERP system’s demands and be a way of seeing the video/image data for events/actions as intended.
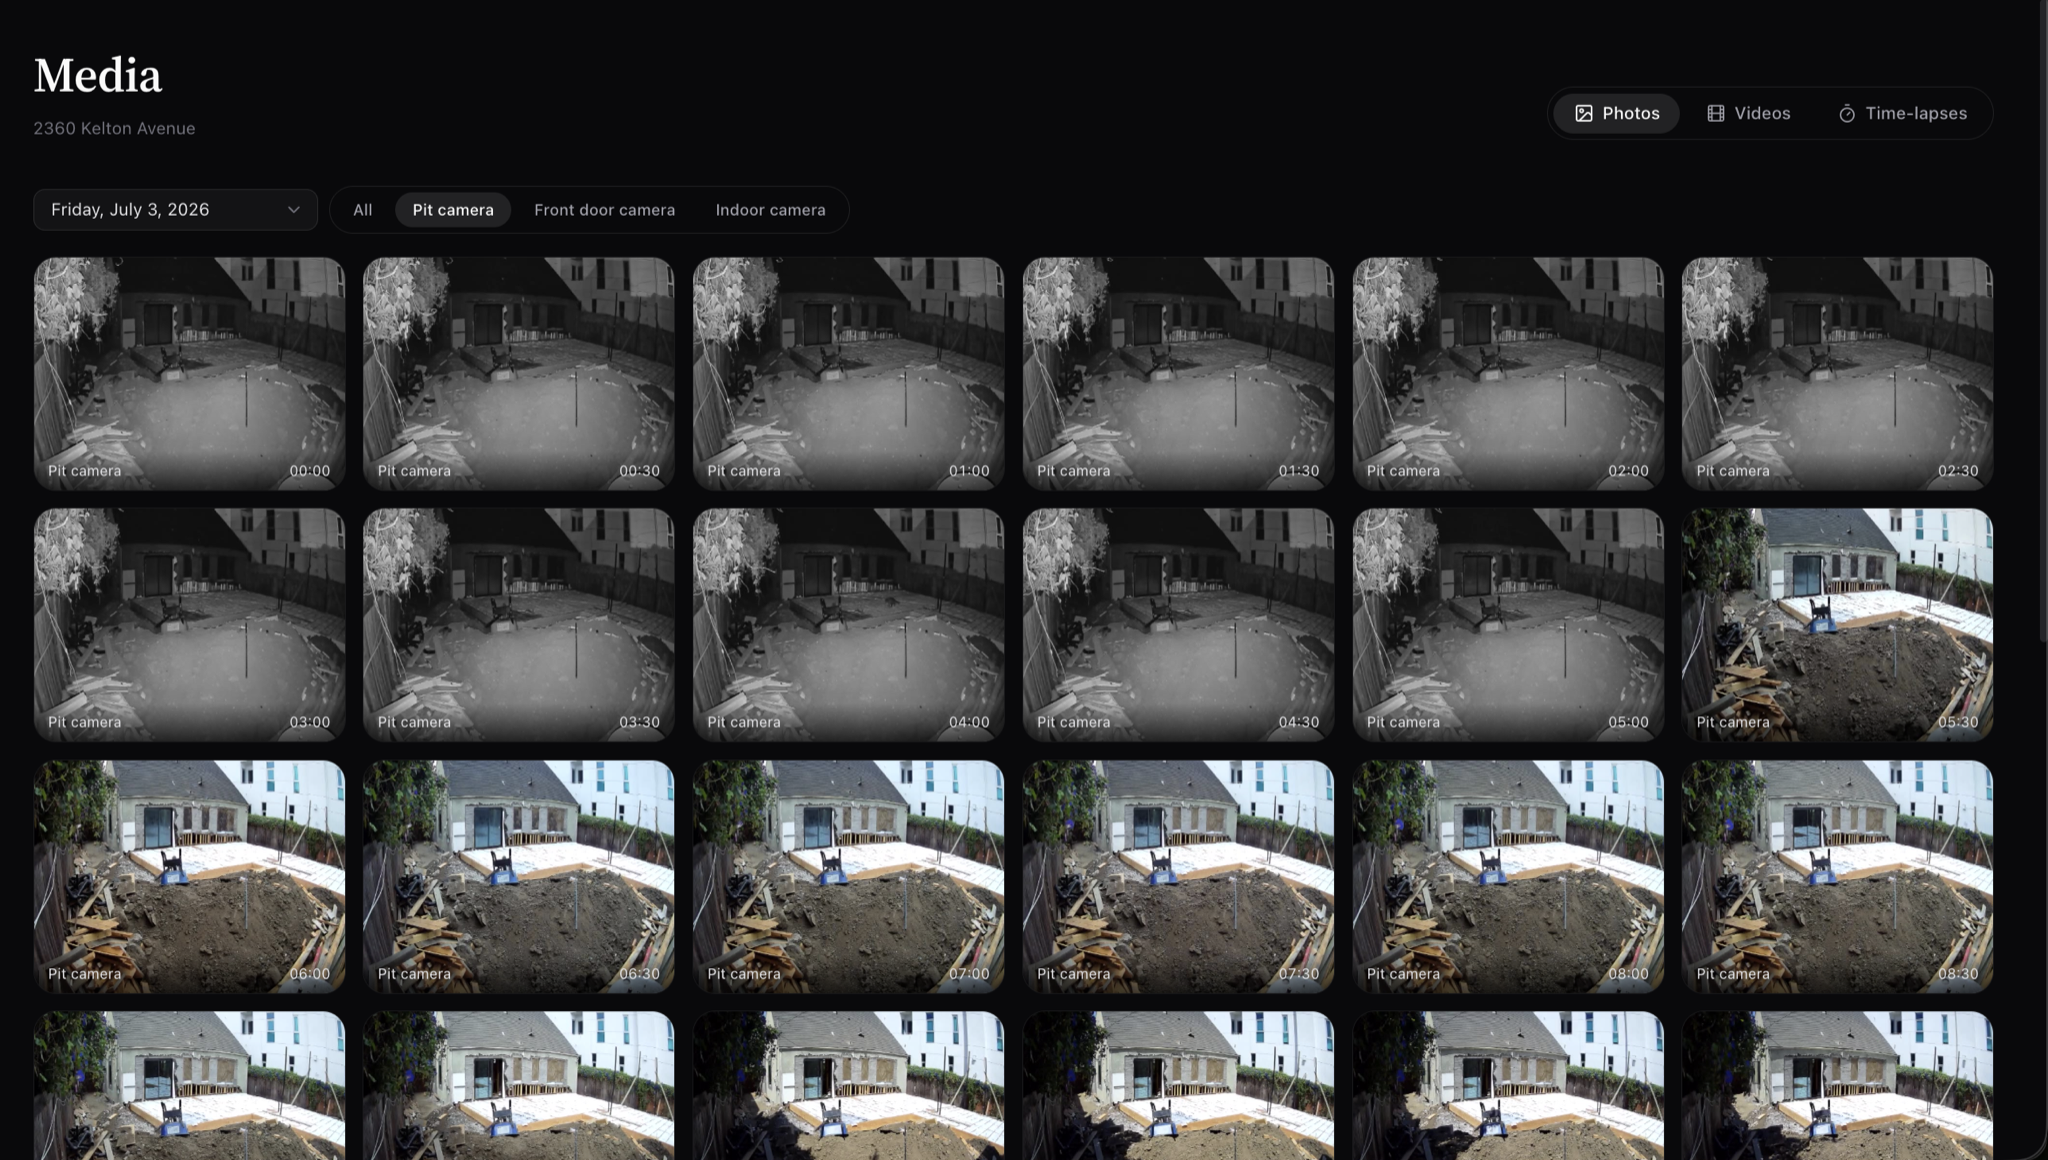
Media → Photos — browse the same archive with a day picker and camera filter.
- Notes — click any photo or any point on either strip to leave a note.
Backend
- AI day-summary pipeline — adaptive frame reads: one coarse pass per hour (“did anything change?”), then a detailed second pass only on active hours.
- Scan ingest pipeline — drop a raw scan in a folder; it fuses, registers, uploads, and cleans up locally once safe.
- Alignment-report engine — Analyses scans for alignment error and gives you metrics to make adjustments.
- Streaming at scale — click-to-play with a shared signed-URL cache; architecture capable of scaling to 50-100 cameras concurrently.
Site Timeline — a day in review
The headline feature. Pick a day; get what happened, how many workers, what work got done — from the cameras.
Site Summary — July 2
“Construction crew worked on foundation and structural components during the morning hours. Workers were active from 10:10 AM until around 12:45 PM, focusing on subfloor installation and material handling in the pit area.”
| Metric | Value |
|---|---|
| Crew | 2 |
| Peak | 2 |
| Person-hours | 5 |
Activities
| Time | Activity |
|---|---|
| 10:10–12:45 | Foundation / subfloor work |
| 11:00–12:00 | Plywood installation |
| 10:10–12:00 | Material handling |
Scans
How can I see the changes to Sentinel?
Open Sentinel and sign in with the prefilled test admin account. Pick 2360 Kelton Avenue, then:
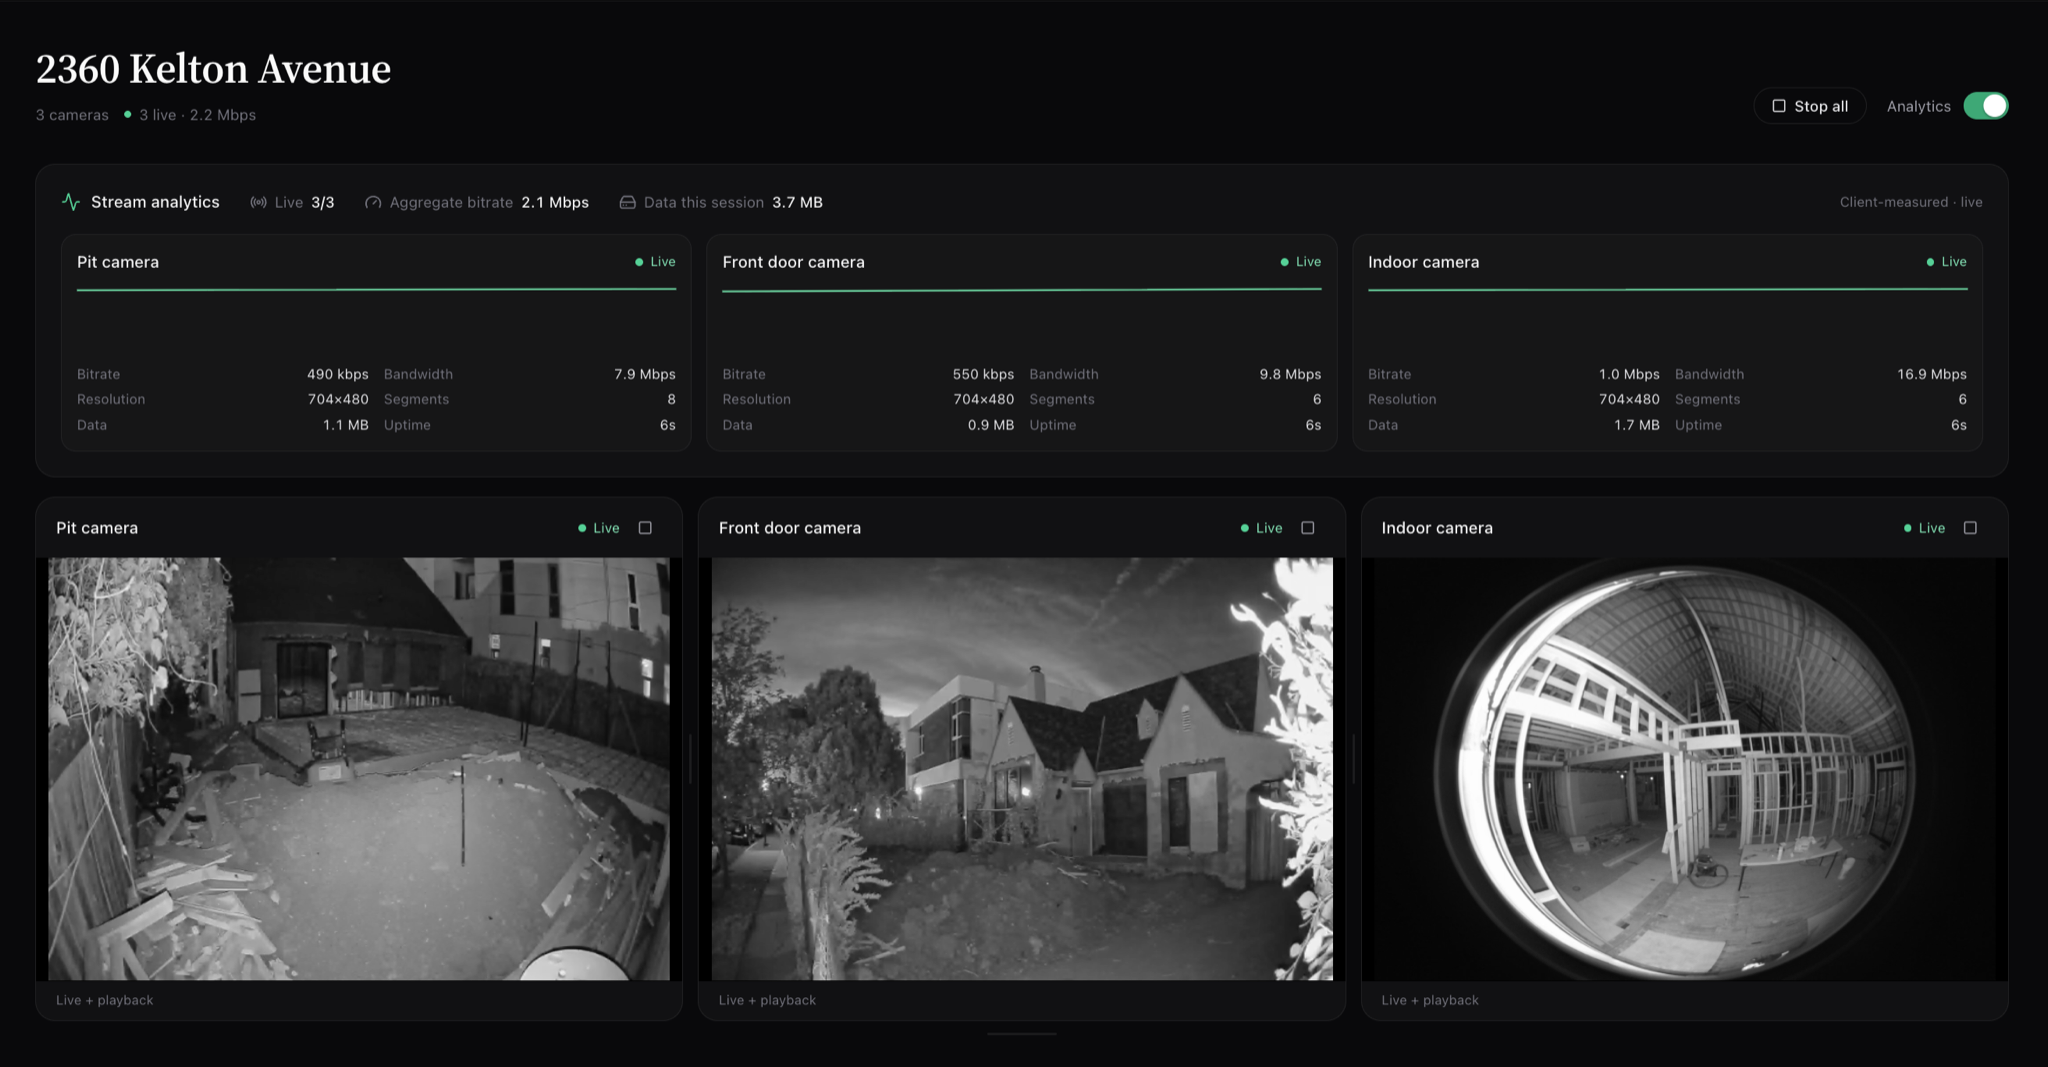
- Stream — live stream from all three real cameras
- Timeline — capture strip, schedule, and day summaries; click a photo or either strip to leave a note
- Media → Photos — browse the raw capture archive by day
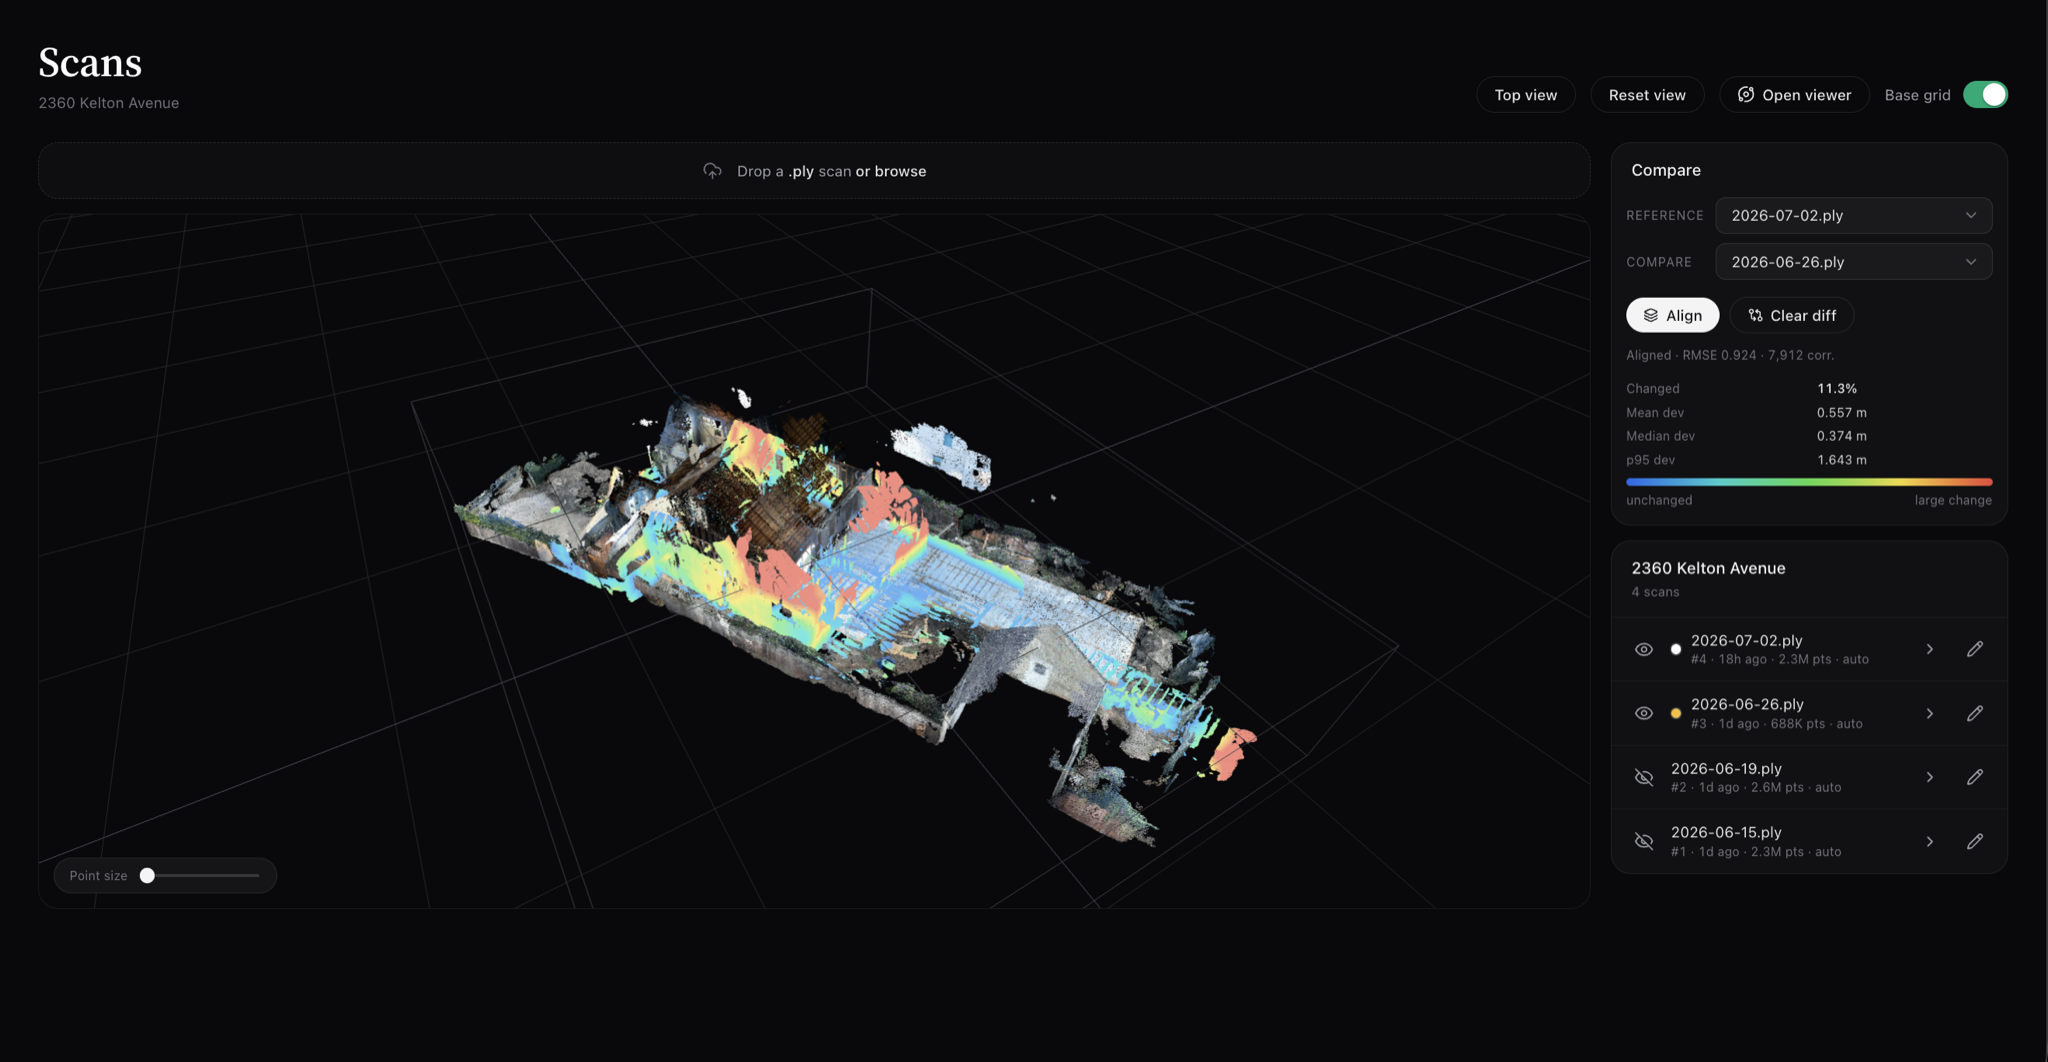
- Scans — align two point clouds and see the measured diff
Last week’s goals — where we landed
| Goal | Status |
|---|---|
| Align two scans and show a diff | Done — plus overlap-quality scoring before diff |
| Progress metric per stage | Done — 41.3 m³ framing (above) |
| Tidy up Scans tab | Done — alignment panel, viewer button, plan-view camera |
| Finalize scan registration | Done — fully automated ingest pipeline |
| Valuation / payout per diff | Open — diffs now carry a confidence score; revisit to make more robust |
| Benchmark vs Memories.ai | Open — went sampled-frame first (much cheaper); need to consider what to incorporate for auto logging over long term (days in between) |
Also shipped from the longer list: worker utilization from footage (crew / person-hours in day summaries), and task-related progress tracking via the schedule pane.
What’s the goal for next week?
- Source of truth - make sure that our metrics, logged activities are as accurate as possible to set a good baseline
- Nightly reconciliation — merge human inputs against AI history, revise summaries, keep every prior version
- OSHA-relevant compliance signals from the same footage we’re already analyzing
- Valuation / payout per diff — now that diffs carry a real confidence score